Show the business what presales moves.
Headcount asks and budget reviews go better with numbers. PresalesIQ keeps the figures that prove presales impact current on their own, from coverage and attach rate to the revenue riding on product gaps.
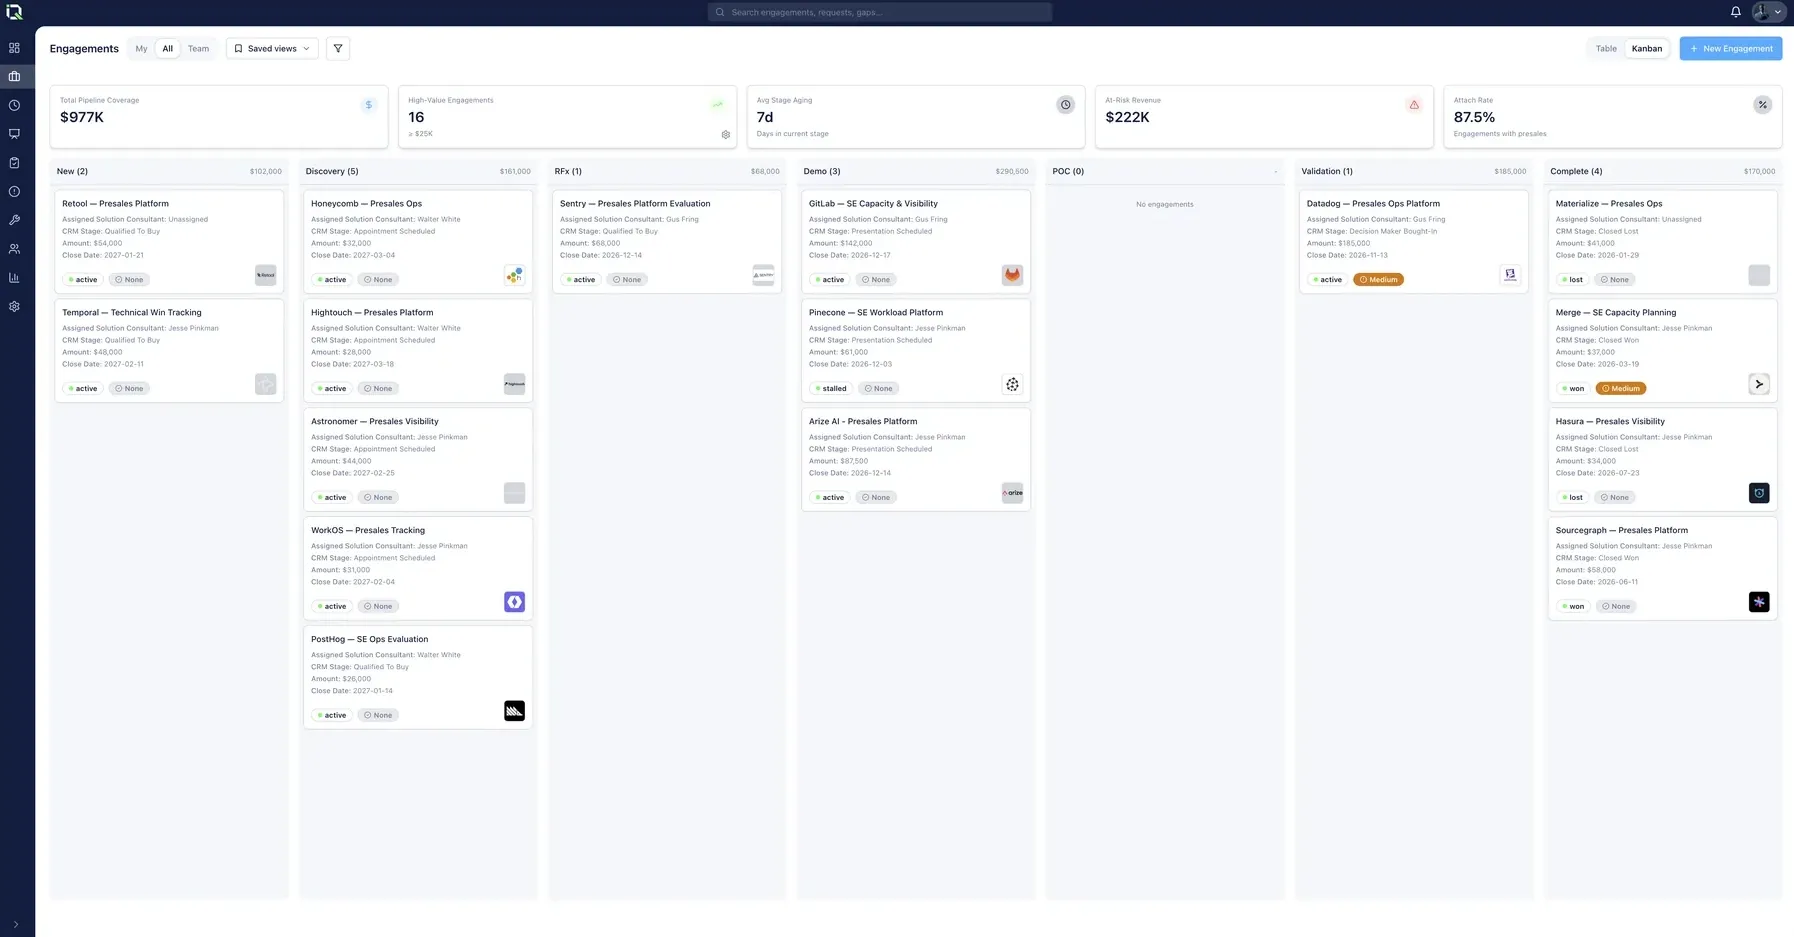
The numbers behind the technical win
Coverage and attach rate
How much of the pipeline presales touches, updated on its own.
At-risk revenue
The revenue riding on evaluations that have stalled or flagged risk.
Activity and cost per engagement
Meetings logged against every deal, with costs rolled up to each engagement.
Gaps priced in revenue
The pipeline behind every product gap, ready for the roadmap review.
Questions teams ask
Which presales metrics does PresalesIQ track?
Coverage, attach rate and at-risk revenue across the pipeline, activity and cost on every engagement, and the revenue at risk behind each product gap.
Can I estimate the return before buying?
Yes. The ROI calculator estimates what your team wins back from manual logging, POC waste and demo engineering requests with no deal context.
Where does the revenue data come from?
From Salesforce or HubSpot, synced with every engagement.
Keep exploring: ROI calculator · POC cost calculator · For presales leaders
See every technical win before the forecast call.
Every deal, every risk and where the technical win stands, on one live screen. Thirty minutes is all it takes.